Web Performance: Core Web Vitals & INP
Introduction
Welcome to the ultimate guide on web performance! In today's digital age, the performance of your website can make or break your business. One of the key metrics Google uses to measure this is Core Web Vitals. And guess what? There's a new kid on the block—Interaction to Next Paint (INP). Let's dive in!
Core Web Vitals: A Primer
Before we get into the nitty-gritty of INP, let's quickly recap what Core Web Vitals are:
- Largest Contentful Paint (LCP): Measures loading performance. Aim for an LCP of 2.5 seconds or less.
- First Input Delay (FID): Measures interactivity. Aim for an FID of 100 milliseconds or less.
- Cumulative Layout Shift (CLS): Measures visual stability. Aim for a CLS score of less than 0.1.
Learn more about Core Web Vitals from Google's official documentation.
Why Core Web Vitals Matter
You might be wondering, "Why should I care?" Well, here's why:
- User Experience: A faster website provides a better user experience.
- SEO Benefits: Google uses Core Web Vitals as a ranking factor.
- Business Impact: Improved performance can lead to higher conversion rates.
Check out this study by Deloitte that shows how a faster website can increase conversions by up to 8%.
Interaction to Next Paint (INP): An In-depth Look
Now, let's talk about the new metric that's making waves—Interaction to Next Paint (INP).
Definition and Importance
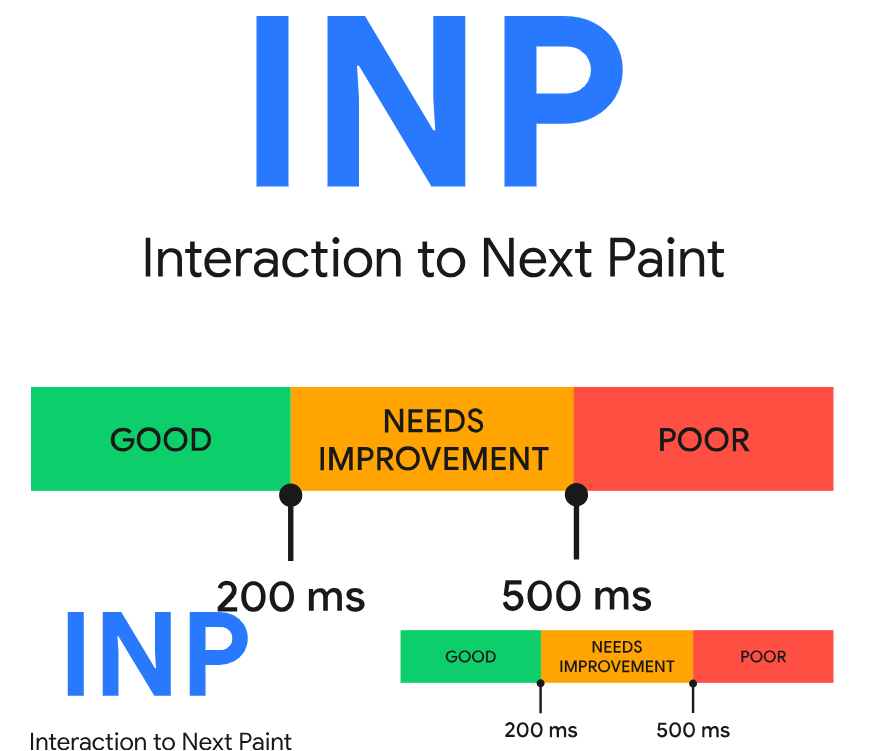
INP measures the latency of interactions on a webpage. The goal is to have an INP of 200 milliseconds or less. Understanding and optimizing Input Delay, Processing Time, and Presentation Delay (collectively known as INP) is crucial for any web developer aiming to provide a seamless user experience.
This comprehensive guide will walk you through the steps to diagnose and optimize INP effectively.
How INP is Measured
INP is calculated by observing the latency of interactions throughout a user's visit. The final INP value is the longest interaction observed.
The 200 Milliseconds Target
To ensure a good user experience, aim for an INP of 200 milliseconds or less. Measure this at the 75th percentile of page loads, segmented across mobile and desktop devices.
Variability in INP Across Different Types of Websites
Depending on your website, INP can vary. For instance, text-heavy websites may have fewer interactions, while gaming websites may have thousands.
Diagnosing INP Issues
Before diving into solutions, it's essential to identify the problem. Collect data to assess your website's INP performance. With this data in hand, you can proceed to detailed analysis and troubleshooting.
Before you can optimize INP, you need data. Here's how to get it:
- Google PageSpeed Insights: To tackle sluggish interactions, you first need data to gauge if your website's INP requires attention. Armed with this data, you can then proceed to the lab for a detailed analysis of the slow interactions and formulate a solution. Use tools like Google PageSpeed Insights for this.
- Field Data vs Lab Data: The best place to start your INP optimization is with real-world data. Real User Monitoring (RUM) can provide invaluable insights into not just the INP value but also the specific user interactions affecting it. Field data gives you real-world insights, while lab data helps you diagnose issues in a controlled environment.
- Real User Monitoring (RUM) Providers: Real User Monitoring (RUM) providers can offer invaluable insights, not just on the INP value of a page but also on the specific interactions contributing to that value. This includes the timing of the interaction, the nature of the interaction (be it a click, tap, or keypress), and other crucial data. RUM providers like New Relic offer detailed insights into your website's INP performance.
- Chrome User Experience Report (CrUX): If you're not using a RUM provider, CrUX can fill in the gaps. It provides a high-level summary of metrics, including INP.
Read more: Understanding Slow Interactions in the Field
Strategies for Optimizing INP
Once you've got the data, it's time to optimize. Here's how:
Lab Diagnosis of Slow Interactions
Once field data indicates slow interactions, lab testing becomes the next logical step. In the absence of field data, you can identify slow interactions by simulating common user flows and interactions, particularly during page load when the main thread is busiest.
Read more: Lab Diagnosis Techniques for Slow Interactions
Interaction Optimization Strategies
After pinpointing a sluggish interaction, the next phase is optimization. Interactions can be dissected into three segments:
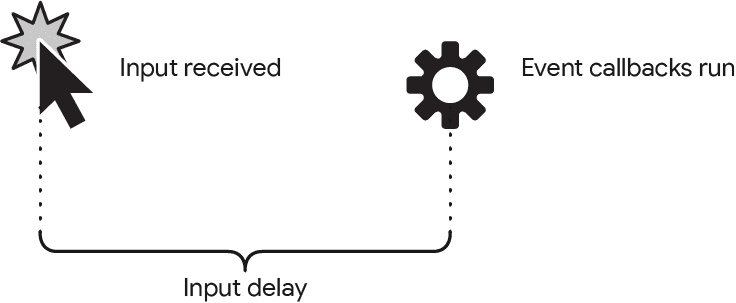
- Input Delay: The time from when the user initiates an interaction until the event callbacks start running.
- Processing Time: The duration it takes for the event callbacks to complete.
- Presentation Delay: The time required for the browser to display the visual outcome of the interaction.
Understanding these phases helps in optimizing each segment to minimize the total interaction latency.
Key Insight: Each browsing context, including iframes, has its own main thread. INP metrics are aggregated at the page level, so it's crucial to know which frame an interaction occurs in.
Minimizing Input Delays
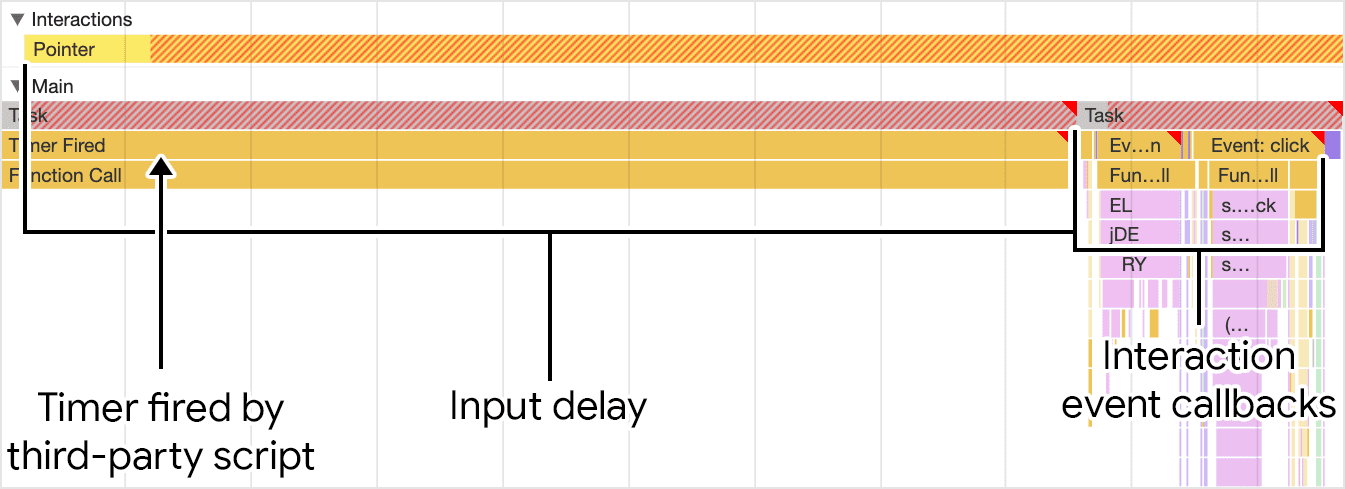
Input delay is the initial phase of any interaction. Various factors, such as main thread activity or overlapping interactions, can prolong this delay. The goal is to minimize this delay for quicker event callback execution.
Here's what you need to know:
-
Understand Input Delay: Know what input delay is and how it affects the user experience.
-
Avoid Recurring Timers: Limit the use of
setTimeoutandsetIntervalin JavaScript, as they can contribute to input delay. -
Minimize Long Tasks: Break up long tasks into smaller ones to avoid blocking the main thread.
-
Use Web Workers: Offload JavaScript tasks to web workers to free up the browser's main thread.
-
Optimize Rendering: Avoid complex layouts and reduce the scope of style calculations to minimize rendering time.
-
Manage DOM Size: Keep the DOM size in check to improve interactivity.
-
Debounce Inputs: For form fields and autocomplete features, consider debouncing inputs to limit event callback executions.
-
Use AbortController: For fetch requests, use AbortController to cancel outgoing requests and prevent main thread congestion.
-
Opt for CSS Animations: Use CSS animations instead of JavaScript animations to reduce the load on the main thread.
-
Be Mindful of Interaction Overlap: Avoid overlapping interactions that can cause additional input delay.
Read more: Strategies to Minimize Input Delay
Script Evaluation and Its Impact
During page load, script evaluation can introduce long tasks that delay other user interactions. Understanding how to mitigate this can keep your page responsive. Here's what you need to do:
-
Understand Script Evaluation: Know that script evaluation is a necessary part of executing JavaScript in the browser. It involves parsing for errors, compiling into bytecode, and then execution.
-
Be Aware of Long Tasks: Long tasks from loading scripts can interfere with user interactions and affect a page's Interaction to Next Paint (INP) during load.
-
Use Smaller Scripts: Avoid loading large chunks of JavaScript. Instead, load more individual, smaller scripts using additional
<script>elements. -
Type=Module Attribute: Utilize the
type=moduleattribute on the<script>element to load ES modules natively in the browser. This approach schedules tasks differently across browsers. -
Dynamic Import(): Use dynamic
import()calls to reduce the size of your initial bundles. This technique is called code splitting. -
Web Workers: Consider using web workers to run code off the main thread, reducing main thread congestion and improving responsiveness.
-
Compression Efficiency: Balance the need for compression efficiency with the need to break up scripts into smaller files to facilitate better interactivity.
-
Cache Invalidation: Be mindful of how breaking up your scripts affects browser caching. Smaller, separate files are more likely to be cached effectively.
-
Module Preloading: If using ES modules without bundling, use the
modulepreloadresource hint to optimize the loading of modules during startup. -
Monitor Metrics: Keep an eye on metrics like Total Blocking Time (TBT) to gauge the impact of script evaluation on page load performance.

Read more: Impact of Script Evaluation on Interactivity
Optimizing Event Callbacks
The input delay is just the starting point; optimizing event callbacks is equally crucial. Breaking up tasks using setTimeout can prevent long tasks and improve responsiveness.
Here's what you need to do to optimize long tasks:
-
Understand Tasks: A task is a discrete piece of work that the browser performs, such as rendering, parsing HTML/CSS, and running JavaScript.
-
Main Thread: Most tasks run on the main thread, which can only process one task at a time. Tasks that take longer than 50 milliseconds are considered "long tasks."
-
Break Up Tasks: Divide long tasks into smaller tasks to allow the browser to handle higher-priority work, such as user interactions.
-
Defer Code Execution: Use
setTimeout()to defer non-critical work to a separate task. -
Use Async/Await: Create yield points in your code using async/await to allow the main thread to handle more important tasks.
-
Check for User Input: Use
isInputPending()to check if the user is trying to interact with the page and yield to the main thread if true. -
Scheduler API: The upcoming Scheduler API, including
postTask(), allows for finer-grained task scheduling and prioritization. -
Yield Only When Necessary: Use time-based approaches or
isInputPending()to yield to the main thread only when it's critical. -
Built-in Yield with Continuation: The proposed
scheduler.yieldAPI allows for yielding to the main thread and continuing from where it left off. -
Task Management Strategies: Use a combination of these techniques to manage and prioritize tasks effectively.
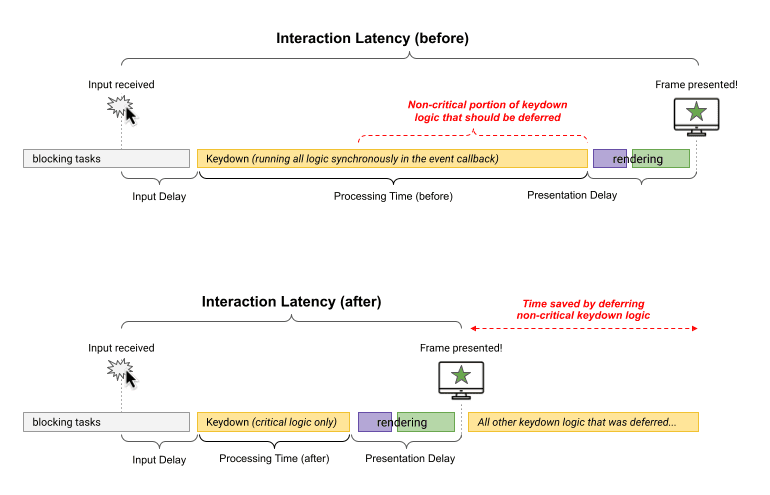
For complex interactions, you can employ advanced yielding techniques to prioritize visual updates and defer other tasks, thereby improving rendering time.
Avoiding Layout Thrashing
Layout thrashing can be a performance bottleneck. Understanding how to avoid it can significantly improve your site's responsiveness. Here's what you need to know and do to avoid large, complex layouts and layout thrashing:
-
Understand Layout Process: Familiarize yourself with how browsers calculate the geometric information of elements based on CSS, contents, and parent elements.
-
Minimize Interaction Latency: The time it takes for an interaction to complete is known as interaction latency. Aim to minimize this by avoiding unnecessary layout calculations.
-
Avoid Forced Synchronous Layouts: When you read a style value and then immediately change it, you force the browser to recalculate layouts synchronously, which is inefficient.
-
Batch Style Reads and Writes: Always read style values first and then make changes to avoid forced synchronous layouts.
-
Limit DOM Size: The size of the DOM has a direct relationship with the cost of layout. Larger DOMs generally incur higher layout costs.
-
Use DevTools for Analysis: Utilize Chrome DevTools to analyze how long layout calculations are taking and identify bottlenecks.
-
Avoid Layout Thrashing: Don't perform multiple forced synchronous layouts in quick succession. This is known as layout thrashing and is highly inefficient.
-
Consider Using FastDOM: For added safety, consider using FastDOM to automatically batch your reads and writes, preventing forced synchronous layouts or layout thrashing.
Read more: How to Avoid Layout Thrashing
Minimizing Presentation Delays
The size of a page's DOM can impact rendering time.
-
Measure DOM Size: Use tools like Lighthouse or JavaScript console to measure the DOM size. Lighthouse starts warning when a page's DOM exceeds 800 nodes.
-
Reduce DOM Depth: Simplify your DOM structure by reducing unnecessary nesting of elements.
-
Limit CSS Complexity: The complexity of CSS selectors can add to the rendering work, so aim to simplify them.
-
Use Fragments: If you're using component-based frameworks like React, Preact, Vue, or Svelte, consider using fragments to reduce DOM depth.
-
Lazy Load Elements: Consider an additive approach where initially hidden parts of the page are loaded only when needed.
-
Content-Visibility Property: Use the CSS
content-visibilityproperty to lazily render off-screen DOM elements. -
Monitor in Real-Time: Use performance monitoring tools to correlate layout and styling operations with the current DOM size.
-
Optimize for INP: Aim to reduce the amount of rendering work your page does in response to interactions to improve INP.
-
User Feedback: Always keep the user informed with loading indicators or other UI elements if network requests are being made.
Techniques like using the CSS content-visibility property can help in reducing this time.
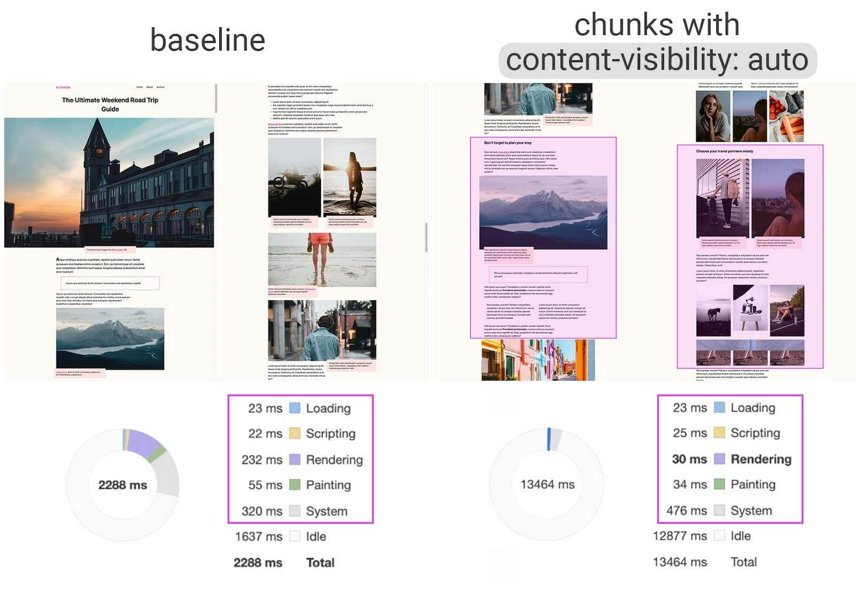
Learn more about content visibility here.
Rendering HTML Efficiently
The method you choose for rendering HTML can have performance implications. Whether you're using server-side rendering or client-side rendering, understanding the trade-offs is crucial.
-
Understand the Difference: Familiarize yourself with how client-side rendering differs from server-side rendering, especially in terms of performance impact.
-
Optimize Server-Side Rendering: Whenever possible, provide as much HTML from the server as you can. This optimizes parsing and rendering, leading to better performance metrics like Interaction to Next Paint (INP).
-
Limit Client-Side DOM Nodes: Keep the DOM size as small as possible when rendering on the client-side to reduce the amount of processing time required.
-
Use Streaming APIs: If you're using Node.js or other JavaScript runtimes, make use of streaming APIs to send HTML as soon as possible.
-
Framework-Specific Optimizations:
- For React, use the Server DOM API.
- For Vue, take advantage of server-side APIs or consider higher-level abstractions.
- For Svelte, leverage SvelteKit for best practices.
-
Consider Alternative Architectures: Explore the use of a streaming service worker architecture to speed up the delivery of HTML to the client.
-
Monitor Performance Metrics: Keep an eye on key performance indicators like INP, Largest Contentful Paint (LCP), and Total Blocking Time (TBT) to gauge the effectiveness of your optimizations.
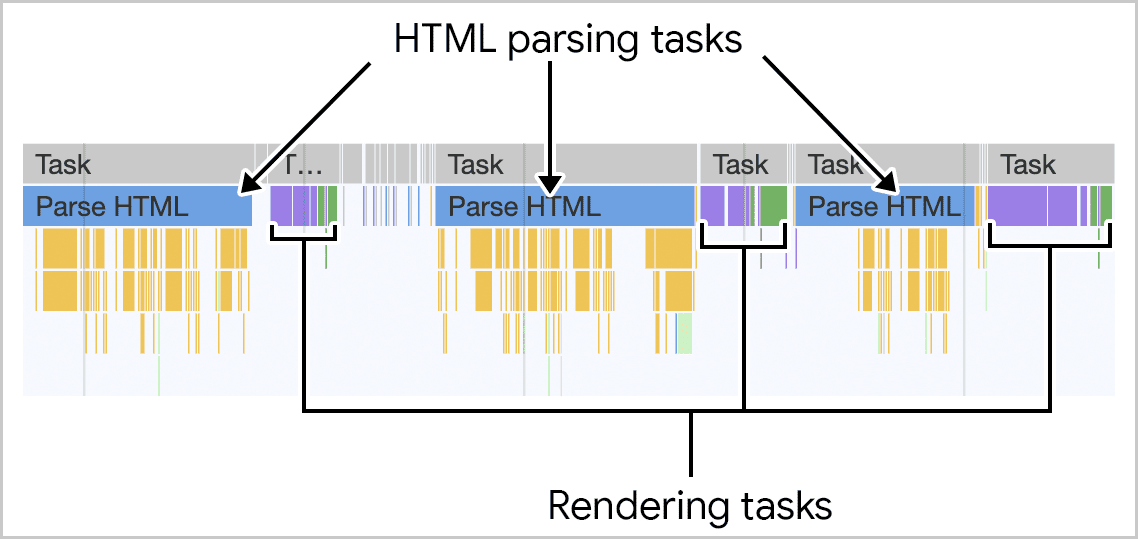
Read more: Efficient HTML Rendering Techniques
Practical Examples
Let's look at a real-world example—a rich text editor. When a user types, several things need to happen. The text box updates, the word count changes, spelling is checked, and changes are saved. By optimizing each of these steps, you can significantly improve INP.
// Example Code
textBox.addEventListener('input', (inputEvent) => {
  updateTextBox(inputEvent);
  requestAnimationFrame(() => {
    setTimeout(() => {
      updateWordCount();
      checkSpelling();
      saveChanges();
    }, 0);
  });
});
Additional Considerations
- DOM Size: A smaller DOM usually means faster rendering times.
- Content-Visibility Property: Use the
content-visibilityproperty to lazily render off-screen elements. - Client-Side Rendering: Be cautious when rendering large amounts of HTML through JavaScript as it can impact INP.
Future Trends and Updates
Optimizing INP is an ongoing process that requires consistent effort. As you add new features, you'll likely encounter new performance issues that will need optimization. The key is persistence; it's an investment that pays off in the form of a better user experience.Stay updated with the latest trends in web performance. Subscribe to Google's Web Developers Blog for the latest updates.
Additional Resources
I hope you find this comprehensive guide useful. Remember, the key to a high-performing website is continuous optimization. Happy optimizing!
